I had more that I wanted to talk in my previous post on how to use a debugger in Java, but it was getting long so I decided to split it up into two parts. If you haven’t read that yet then I highly recommend you do that before this continuing with this post.
We will be reusing the same “Drinks” code from the first part.
Expressions
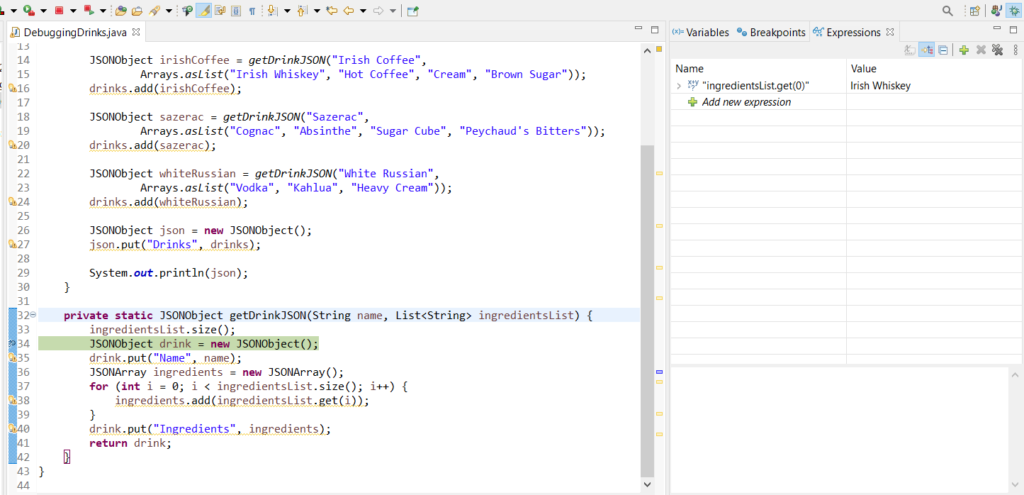
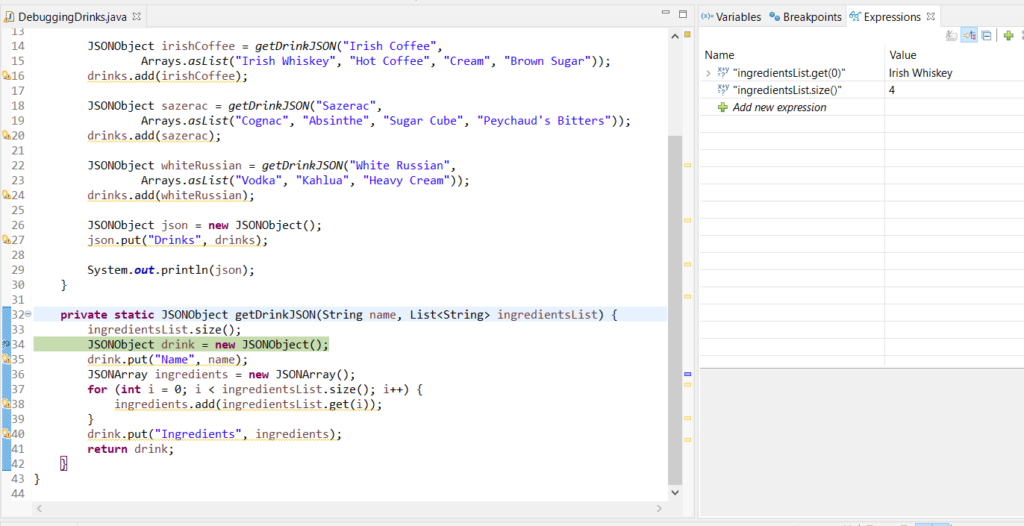
You may have noticed that there is also an “Expressions” window in addition to the “Variables” window in the Debug perspective. We can use this to quickly look for particular fields, lets say we wanted to quickly peek at the first element in the parameter list in our getDrinkJSON method.
Or maybe we wanted to see the size of the parameter list?
Changing Values
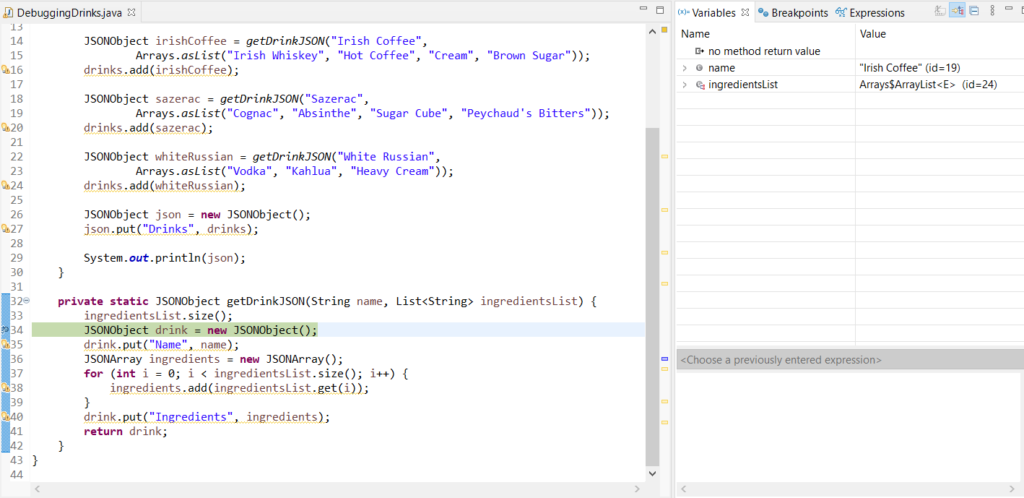
We can also use the debug perspective to not just look at values, but to actively change values as well! From our same breakpoint at line 34 we can see that our drink name is “Irish Coffee”
We can go ahead and change that to something else directly in the Variables window
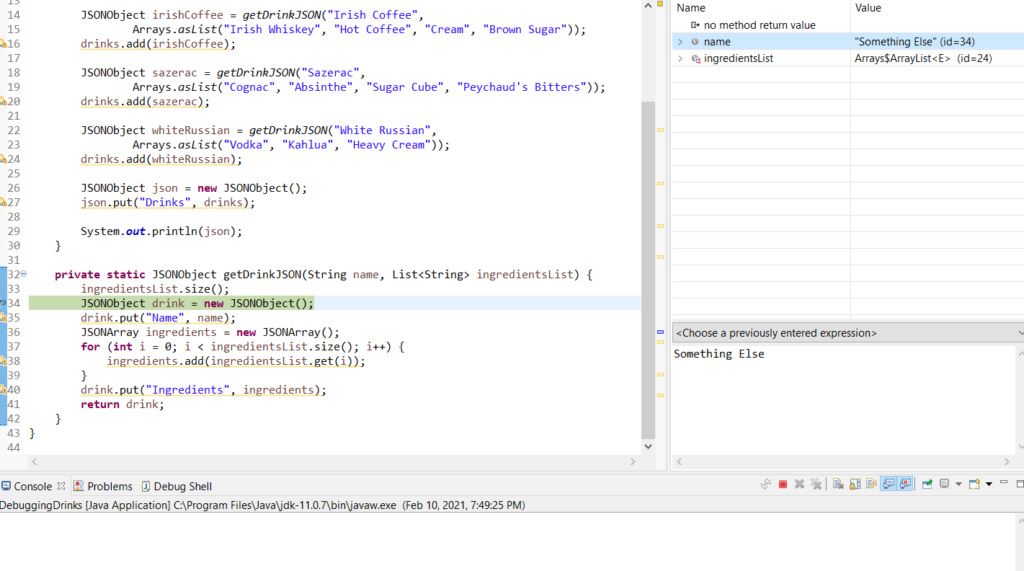
Then we can see that the name in our output would be:
{
	"Drinks": [
		{
			"Ingredients": [
				"Irish Whiskey",
				"Hot Coffee",
				"Cream",
				"Brown Sugar"
			],
			"Name": "Something Else"
		},
	[...]
}
Conditional Breakpoints
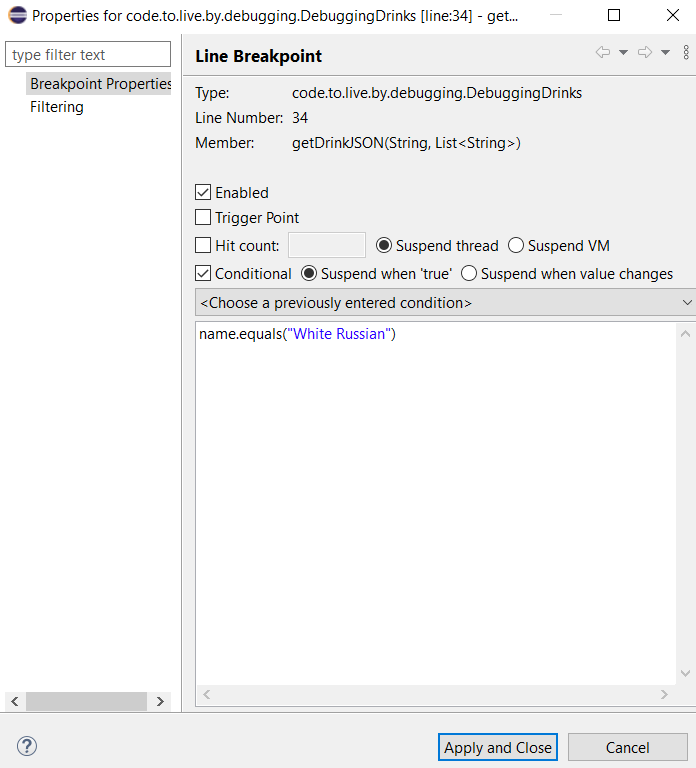
We also have options to limit how frequently our breakpoints will be hit. We can edit our breakpoint that we set at line 34 by right clicking on it and selecting “Breakpoint Properties.”
From here we can set a condition, only when the condition is true will our breakpoint be hit. We could for example set it so that we only break for one particular drink, rather than for each of them.
Exception Breakpoints
We can also set breakpoints that will trigger on uncaught exceptions. Let’s say we “accidentally” passed null as our ingredients for our Irish Coffee for some reason.
JSONObject irishCoffee = getDrinkJSON("Irish Coffee", null);
We can then add a “Java Exception Breakpoint” through the Breakpoints window for NullPointerExceptions
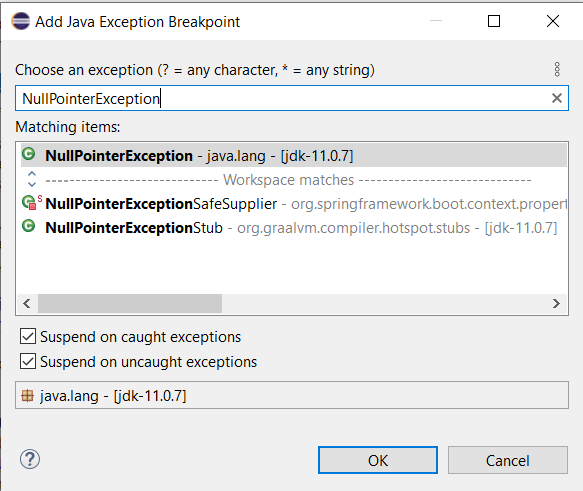
Then, if we Debug our program, we see that it will suspend at line 35, when it tries to use our null parameter to get the size of the ingredients for our loop condition.

Hopefully this helps you add feel confident in having the Debugger as another tool in your developer toolkit.